

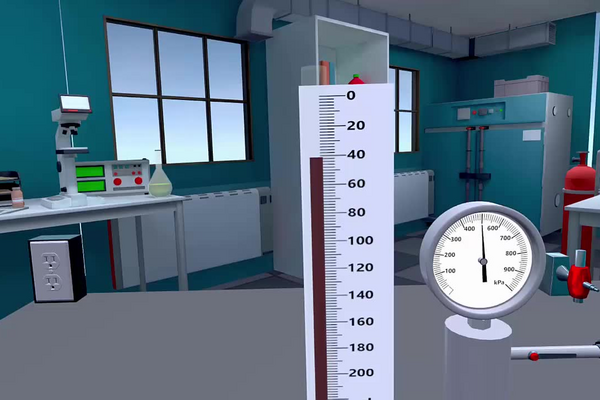
The Boyle apparatus is the instrument that made the first gas law measurable, and a version of it still stands in most physics and chemistry teaching laboratories. A fixed quantity of air is trapped in a graduated vertical tube above a reservoir of oil; the oil is incompressible and gas-tight, so it behaves as a piston that seals perfectly and slides without friction. Pump air into the reservoir and the oil rises, squeezing the trapped column into a smaller and smaller space while a manometer records the pressure. The same principle governs a bicycle pump, the compression stroke of an engine, an aerosol can, a diver’s lungs on ascent and the hydraulic accumulator on a piece of heavy machinery.
The relationship being measured is Boyle’s law: for a fixed amount of gas at constant temperature, P × V is a constant. Pressure is the accumulated force of molecules striking the walls, so packing the same number of molecules into half the space doubles how often they arrive and doubles the pressure. Two conditions have to hold for the law to be exact, and both are conditions the apparatus has to be operated carefully to meet: the amount of trapped gas must not change, which is what the oil seal guarantees, and the temperature must not change, which is why compressed air is given time to cool before anything is written down.
In this laboratory you will connect the hand pump, check that the tap is open, and pump until the manometer reads about 500 kPa, watching the oil climb and the air column shrink. You then close the valve, wait a minute for the compressed air to return to room temperature, and record the volume of the air column and the pressure. Releasing the air in stages gives a series of matched readings from the compressed column back out to its full 200 mL. Plotting pressure against volume produces a hyperbola; plotting it against 1/V straightens that curve into a line through the origin whose slope is the Boyle constant for the sealed sample.
Educational Goals
Familiarization with the laboratory environment
- Identify the parts of the Boyle apparatus — oil reservoir, graduated air column, tap and manometer — and state what each one does.
- Explain why a liquid, rather than a solid piston, is used to seal and compress the trapped air.
Operating a pressurised system safely
- Connect the pump hose and confirm the seal before pressurising anything.
- Pump to a target pressure, close the valve at the right moment, and bleed the system down in controlled steps rather than all at once.
Measurement and data recording
- Read the oil meniscus against the graduated column and the needle against the manometer face, and record the two as a matched pair.
- Wait for thermal equilibrium before recording, and explain what a reading taken too early would look like.
Quantitative treatment of Boyle’s law
- Compute P × V at every reading and judge whether the spread in that column is small enough to support the claim that it is constant.
- Plot absolute pressure against 1/V, fit a straight line, and interpret its slope as the Boyle constant and its intercept as a diagnostic.
- Predict the volume at a pressure that was not measured, using P1V1 = P2V2, and check it.
Critical evaluation of the measurement
- Distinguish gauge pressure from absolute pressure and establish which one this instrument reports before using the readings.
- Identify the systematic effects that would make the product drift — the hydrostatic head of the oil, dead volume in the connecting tube, incomplete cooling and gas non-ideality — and estimate their size.
Protocol
- Locate the Boyle’s apparatus.
- Connect the air pump hose to Boyle’s apparatus.
- The connection of the oil reservoir to the air column must be such that there is no leakage and that the air is completely isolated by the oil.
- Make sure the tap of the Boyle apparatus is open.
- After connecting the tube to the Boyle’s apparatus, you begin to pump air using the air pump. Pump until the manometer reaches approximately 500 kPa.
- When air is pumped into Boyle’s apparatus, an increase in pressure is observed, as indicated by the manometer. When the air circulates through the oil reservoir, the pressure inside the system increases, which causes the oil column to rise and results in a corresponding decrease in the volume of the air column.
- Close the air valve once the oil no longer rises and the pressure gauge reading is constant.
- You can detach the air hose from Boyle’s apparatus.
- Wait 1 minute to cool the compressed air and note the reading of the volume of the air column (in ml) and the gauge pressure (in kPa).
- Now, press the button at the base of the Boyle’s apparatus to let the air escape from the system. This will lower the pressure in the system which will cause the level of the oil column to descend.
- You will obtain a plot of pressure as a function of the volume of the air column. The gauge on this apparatus already reads absolute pressure, so no atmospheric correction is needed. A graph of absolute pressure versus the inverse of the volume of the air column should show a linear relationship through the origin.
Anticipated Outcomes
Expected results. The apparatus traps a fixed column of air above a column of oil. Pumping raises the pressure and drives the oil upward, shortening the air column; releasing the air lets it fall back. The temperature never changes and no air enters or leaves the trapped column, so the only two quantities in play are pressure and volume. The table records the readings taken at 40 kPa intervals as the pressure is released, together with the fully compressed state at the start and the fully relaxed state at the end.
| Volume V (mL) | 1 / V (mL−1) | Absolute pressure P (kPa) | P × V (kPa·mL) |
|---|---|---|---|
| 200.0 | 0.00500 | 101 | 20200 |
| 143.4 | 0.00697 | 141 | 20219 |
| 111.7 | 0.00895 | 181 | 20218 |
| 91.5 | 0.01093 | 221 | 20222 |
| 77.5 | 0.01290 | 261 | 20228 |
| 67.2 | 0.01488 | 301 | 20227 |
| 59.3 | 0.01686 | 341 | 20221 |
| 53.1 | 0.01883 | 381 | 20231 |
| 48.1 | 0.02079 | 421 | 20250 |
| 43.9 | 0.02278 | 461 | 20238 |
| 40.4 | 0.02475 | 501 | 20240 |
| 37.4 | 0.02674 | 541 | 20233 |
The single number to take away. The twelve products average 2.02 × 10⁴ kPa·mL, and they range only from 20200 to 20250 — a spread of ±0.15 % about the mean. Behind the plot the simulation logs a further 470 readings as the pressure bleeds away one kilopascal at a time, and every one of those falls within ±0.5 % of the same value. A quantity that holds to a fraction of one percent while each of its two factors changes by more than 400 % is telling you something. This is Boyle’s law:
P × V = constant (at fixed temperature, for a fixed amount of gas)
or, comparing any two states of the same sample, P1V1 = P2V2. Checking the two extremes of the table: 101 × 200.0 = 20200 and 541 × 37.4 = 20233. They agree to 0.16 %, across the widest separation the apparatus can produce.
Pressure against volume. The measured points lie on a hyperbola: pressure falls steeply as the column is allowed to lengthen, then flattens. The dashed curve is not a fit to the data — it is the single relationship P = 2.02 × 10⁴ / V drawn through them.
The same measurements plotted against the reciprocal of the volume. The curve becomes a straight line through the origin, whose slope is the constant itself.
Reading the two graphs. The first plot has the right shape, but shape alone is weak evidence: a great many decreasing functions look like a hyperbola to the eye, and they cannot be told apart by inspection. The second plot converts the claim into one a ruler can settle. If P = constant / V, then plotting P against 1/V must give a straight line, and that line must pass through the origin. Both conditions carry meaning:
- The slope is the constant. A least-squares line through these points gives 2.02 × 10⁴ kPa·mL — the same figure as the average of the last column, arrived at independently.
- The intercept should be zero, since an infinitely long column would exert no pressure. The fitted intercept is about 0.2 kPa, which is a fifth of the smallest division the gauge can show. It is zero as far as this apparatus can tell.
- The scatter is negligible: the points depart from the line by less than the width of a gauge division, and the fit returns a coefficient of determination above 0.9999.
One detail rewards a second look. The pressures were taken at even 40 kPa intervals, and the reciprocals in the second column turn out to be evenly spaced as well, each about 0.00198 mL−1 from the next. That even spacing is not a coincidence of the apparatus; it is proportionality showing itself in the arithmetic before any graph is drawn.
Why the product stays constant. Pressure is the accumulated effect of molecules striking the wall: each collision delivers a small impulse, and pressure is the total impulse per second per unit area. Halve the length of the column and the same molecules are confined to half the space, so each one reaches a wall twice as often. Nothing about an individual collision changes — the molecules are no faster, because their average speed is fixed by temperature alone, and the temperature has not moved. Only the frequency of collisions changes, and it changes in exact proportion to the crowding. Twice the number density, twice the pressure.
This is also why the law carries two conditions. Constant temperature, because warmer molecules strike harder and more often, raising the pressure with no change in volume at all. A fixed amount of gas, because a leak removes molecules and lowers the collision rate. The two failures look different in the data: a leak makes the product drift steadily downward through a run, while a temperature that has not settled makes it high early and correct later. Random reading error does neither — it scatters the product about its mean without trend.
How much air is in the column. The constant is not merely a number that happens to hold still; the ideal gas law identifies it as nRT. Since PV = nRT and 2.02 × 10⁴ kPa·mL is 20.2 J, at 20 °C:
n = PV / RT = 20.2 / (8.314 × 293) = 8.3 × 10⁻³ mol
roughly 8.3 millimoles, or about 0.24 g of air — some 5 × 10²¹ molecules. A student who gets this far has done more than confirm a proportionality: they have weighed the air in a glass tube using nothing but a pressure gauge and a ruler.
Why the oil column is the right piston. A solid piston would leak past its seal, and any seal tight enough not to leak would carry enough friction to make the pressure depend on which way the piston last moved. Oil solves both problems at once. It is effectively incompressible, so all of the volume change happens in the air and none in the piston; it wets the glass, so there is no path for gas to slip past; and it has no static friction, so the column settles at the true equilibrium position rather than somewhere near it.
The price is a hydrostatic term. Oil of density about 850 kg/m3 standing h metres above the reservoir surface adds ρgh to the pressure at the foot of the air column. For a rise of roughly 0.4 m at full compression that is 850 × 9.81 × 0.4 ≈ 3.3 kPa — only 0.6 % of 541 kPa, but over 3 % of 101 kPa. It is the largest single reason the product in the last column is not perfectly flat, and it explains why the small residual scatter is worst at the relaxed end rather than at the compressed end, where intuition might have put it.
Why the protocol makes you wait a minute. Compressing a gas does work on it and warms it; letting it expand cools it. Pump the column down quickly and the trapped air is briefly well above room temperature, so the gauge reads high; the reading then decays over several seconds as heat passes out through the glass. Boyle’s law holds only at constant temperature, so the minute of waiting called for after the valve is closed is not padding — it is the step that makes the measurement an isothermal one. A run made in a hurry gives high pressures at small volumes and a product that rises as the column is shortened, which is easily mistaken for a real departure from the law.
Gauge pressure and absolute pressure. Boyle’s law is a statement about absolute pressure — pressure measured from a true vacuum — because it is absolute pressure that is proportional to the collision rate. A gauge that reads from atmosphere instead is offset by about 101 kPa, and the product of gauge pressure and volume obeys no simple law whatever.
The instrument in this laboratory reports absolute pressure directly, and the readings prove it: the final row is 200.0 mL at 101 kPa, which is the state with the valve open and the oil at rest. With the air column connected to the room it can only be at atmospheric pressure, and 101 kPa is atmospheric pressure. A gauge instrument would have shown 0 kPa there. No correction is therefore needed, and none should be applied. If students later meet an apparatus reading gauge pressure, atmospheric pressure must be added to every reading before any product is formed — and the origin test on the second graph is the quickest way to catch the omission, since the uncorrected points fall on a line displaced downward by about 101 kPa.
What the precision of the readings will support. The gauge resolves 1 kPa and the volume scale about 0.1 mL. At the compressed end 1 kPa is under 0.2 % of the reading, while at 101 kPa it is a full 1 %; the volume reading behaves in the opposite way, since 0.1 mL is 0.3 % of 37.4 mL but only 0.05 % of 200 mL. The two effects partly offset, which is one reason the product holds as steady as it does across the whole range.
Two points are worth making explicitly to older students. The reciprocal 1/V must be carried to enough significant figures before plotting, since rounding it early collapses distinct measurements onto the same point and flatters the fit. And a single run, however clean, cannot establish an exact inverse proportionality; it establishes that the data are consistent with one to within a fraction of a percent over a fivefold range. That is the honest claim, and it is a strong one. Real gases do depart from Boyle’s law measurably — at high pressure the molecules’ own volume and their mutual attraction begin to matter, which is what the van der Waals equation corrects for — but air at room temperature and a few atmospheres is far from that regime. The air is also damp, and water vapour contributes its own partial pressure; because that contribution is nearly constant at fixed temperature it shifts the constant very slightly rather than curving the line, which is why it does not show up in the graph.
Summary of Assignment by Grade Range
Grade 9–10
Focus. Observation and vocabulary. Students see that a gas can be squeezed into a fraction of its original space and that the pressure needed to do so grows as the space shrinks.
- Pump the apparatus up, watch the oil rise, and describe in words what happens to the air column and to the gauge.
- Take four or five readings on the way down and enter them in a table of volume and pressure.
- Sketch pressure against volume and describe the curve: falling, steep at small volumes, flattening at large ones, never reaching zero.
- Answer qualitatively: to halve the volume again from 50 mL to 25 mL, would the pressure have to rise by more or less than it did from 100 mL to 50 mL?
Grade 11
Focus. Quantitative treatment. Students test the constancy claim numerically and learn to linearise a relationship instead of judging a curve by eye.
- Record all twelve readings, add columns for 1/V and P × V, and state the range of the last column as a percentage of its mean.
- Plot absolute pressure against 1/V, draw the best straight line and measure its slope; compare that slope with the mean of the P × V column.
- Use P1V1 = P2V2 to predict the volume at 400 kPa, then interpolate the measured series to check.
- Explain why the fully released column at 200.0 mL and 101 kPa belongs on the same line as the compressed points.
Grade 12 / College Level
Focus. Derivation, error analysis and independent interpretation. Students are expected to account for the deviations rather than dismiss them.
- Derive P ∝ 1/V both from PV = nRT and from kinetic theory, P = (1/3)(N/V)m⟨v2⟩, and state the assumptions each derivation needs.
- Compute the amount of trapped air in moles, in grams and in molecules, and show that it is unchanged at every point of the run.
- Fit the twelve points by least squares and quote the slope.
- Account for the 0.2 % downward drift in P × V: estimate the real-gas contribution from Z = 1 + BP/RT with B ≈ −7 cm3/mol, estimate the hydrostatic contribution from ρgh, and argue which dominates.
- Compare the isothermal and adiabatic pressures for a compression from 200 mL to 34.7 mL, and use the difference to justify the one-minute wait in step 7 quantitatively.
Laboratory essentials
Instruments
- Boyle apparatus — oil reservoir, graduated air column (0–200 mL) and manometer reading absolute pressure in kPa
- Hand air pump with connecting hose
- Tap and release valve at the base of the apparatus
Products
- Air — 200 mL sealed in the graduated column at atmospheric pressure
- Compressed air — delivered by the hand pump into the oil reservoir
- Sealing oil — fills the reservoir and isolates the trapped air column