

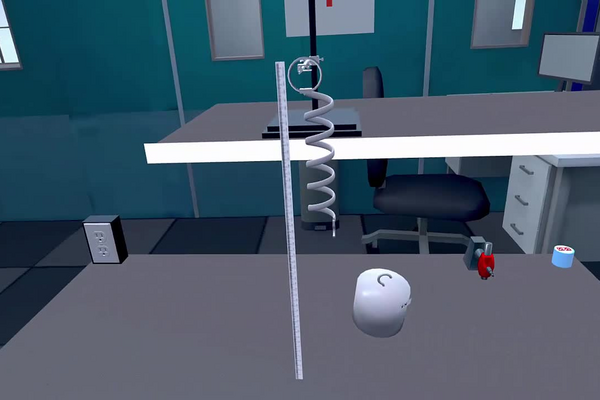
Springs are among the most useful mechanical components ever devised: they suspend vehicles, close doors, keep watches running and return retractable pens. The instrument a laboratory uses to measure force — the newton meter, or dynamometer — is itself nothing more than a calibrated spring, so understanding how a spring responds to a load is understanding how force itself is measured. The response is described by Hooke’s law: within its elastic range, a spring exerts a restoring force proportional to its elongation, F = kΔl, where the spring constant k measures the stiffness of that particular spring. The proportionality is the point — doubling the load doubles the stretch — and it is what makes a spring usable as a measuring device. In this laboratory, you will suspend a spring from a stand, load it with weights from 1 N to 9 N in equal steps, and read the elongation produced by each load against a fixed ruler. Plotting the restoring force against the elongation then reveals the linear relationship, and the slope of that line is the spring constant itself.
Educational Goals
Familiarization with the laboratory environment
- Assemble a suspended spring system from a universal support, clamp, spring and fixed ruler.
- Attach and remove weights in controlled increments without releasing the spring suddenly.
Use of measuring instruments
- Read positions on a fixed ruler at eye level, recognising parallax as the main reading error.
- Allow the loaded spring to come fully to rest before recording, since an oscillating spring has no single elongation.
Understanding Hooke’s law
- Establish experimentally that the restoring force of a spring is proportional to its elongation, F = kΔl.
- Determine the spring constant k of a real spring from measured data.
Graphical and mathematical analysis
- Plot force against elongation, fit a straight line through the origin, and extract k from its slope.
- Convert the spring constant between unit systems (N/cm and N/m) and use it to predict the elongation of an untested load.
Critical analysis of results
- Evaluate what nine measured points establish that a single measurement cannot: the linearity of the relationship, not just its magnitude.
- Relate the calibrated-spring principle to real systems — vehicle suspensions, force gauges and spring balances.
Protocol
- Hang a clamp on the universal support.
- Hook the spring to the clamp.
- Secure the ruler to the clamp next to the spring.
- Measure the distance between the table and the bottom of the spring hook.
- Suspend a weight of 1 N from the spring.
- The value of the restoring force is recorded in the results table.
- Wait until the weight has finished oscillating and measure the distance between the table and the bottom of the spring.
- Repeat steps 5 to 7 each time increasing the suspended weight by 1 N.
Anticipated Outcomes
Measured results. The distance recorded is from the table to the bottom of the spring, so it decreases as the spring stretches. The elongation is the difference from the unloaded reading: Δl = d0 − d.
| Weight (N) | Distance from the table (cm) | Elongation Δl (cm) | F / Δl (N/cm) |
|---|---|---|---|
| 0 | 27.0 | 0.0 | — |
| 1.0 | 25.0 | 2.0 | 0.500 |
| 2.0 | 23.0 | 4.0 | 0.500 |
| 3.0 | 21.0 | 6.0 | 0.500 |
| 4.0 | 19.0 | 8.0 | 0.500 |
| 5.0 | 17.0 | 10.0 | 0.500 |
| 6.0 | 15.0 | 12.0 | 0.500 |
| 7.0 | 13.0 | 14.0 | 0.500 |
| 8.0 | 11.0 | 16.0 | 0.500 |
| 9.0 | 9.0 | 18.0 | 0.500 |
Hooke’s law. Within its elastic range a spring stretches in direct proportion to the force applied to it, and pulls back with a force of the same size directed toward its rest position:
F = k Δl or, written as the restoring force with its direction, F = −k Δl
The constant k is the stiffness of that particular spring. Taking any row of the table, k = F / Δl = 1.0 N / 2.0 cm = 0.500 N/cm, which is 50 N/m in SI units. The final column shows that every one of the nine measurements returns the same value, so a single reading would in principle have been enough — but nine of them establish that the proportionality genuinely holds rather than happening to fit at one point.
Reading the graph. Plotting force against elongation gives a straight line through the origin. Both features carry meaning. The straightness says the stiffness does not change as the spring extends. The fact that it passes through the origin says no force is needed to produce zero extension — there is no slack to take up and no pre-tension in the spring. The slope is k, so the graph is the standard way of measuring a spring constant: take the gradient, not a single pair of readings.
Energy stored in the spring. Because the force grows as the spring extends, the work done in stretching it is not simply force times distance but the area under the line, which is a triangle:
E = ½ k Δl²
At the full 9 N load the elongation is 0.18 m, so E = ½ × 50 × 0.18² = 0.81 J. Note that doubling the elongation quadruples the stored energy, which is why the elongation appears squared while the force does not.
Summary of Assignment by Grade Range
Grade 9–10
Focus: elasticity as an observable, measurable phenomenon. Students assemble the spring system, hang each weight from 1 N to 9 N, record the ruler position at rest, and compute the elongation produced by each load. They plot force against elongation on grid paper and state the pattern in words: equal steps of force produce equal steps of stretch. The emphasis is on careful, repeatable reading of the ruler and on organising measurements into a clear table.
Grade 11
Focus: the quantitative form of Hooke’s law. Students determine the spring constant from the slope of their graph, express it in both N/cm and N/m, and check individual rows of the table against F = kΔl. They use the fitted constant to predict the elongation of a load they did not test and discuss why the graph should pass through the origin. Unit handling — centimetres to metres, N/cm to N/m — is treated as part of the physics, not an afterthought.
Grade 12 / College Level
Focus: energy stored in an elastic system. Students compute the elastic potential energy stored at maximum load as the area under the force–elongation line, E = ½k(Δl)², and verify it against the graph geometrically. They fit the slope by least squares rather than by eye.
Laboratory essentials
Instruments
- Spring (k = 0.5 N/cm)
- 50 cm ruler
- Stand & clamp
- Weights (1 to 9 N)
Products
None — this laboratory uses no chemical reagents.