

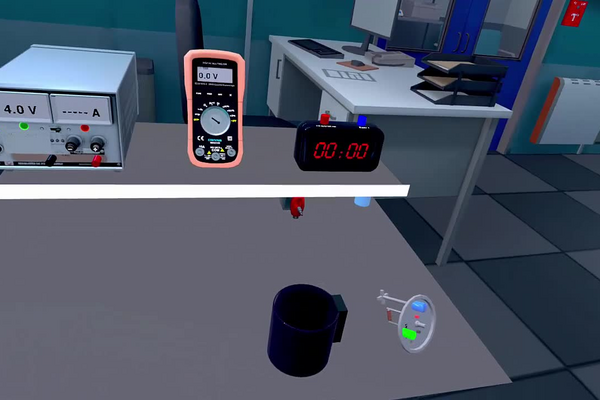
Every device that converts energy from one form to another wastes part of it, and the fraction that reaches its intended destination is what engineers call the efficiency of the device. It is the number printed on the energy label of a refrigerator, the figure quoted for a power station or an electric motor, and the quantity an energy audit of a building is trying to establish. Measuring it always comes down to the same two steps: count the energy going in, then count the energy arriving where it was wanted, and take the ratio.
The instrument used to count the energy that arrives as heat is the calorimeter — an insulated vessel of water fitted with a heater, a stirrer and a thermometer. Electrical energy delivered to the heater is known exactly from the supply voltage, the current and the running time, because E = U I Δt. The heat that ends up in the water is known from its mass, its specific heat capacity and its temperature rise, because Q = m c ΔT. The ratio of the second to the first is the efficiency. Water is used because its specific heat capacity is large, accurately known and almost constant over a small temperature range, so the thermometer becomes a reliable energy meter.
In this laboratory you will assemble that measurement yourself. You will set a power source to 4 V, insert a multimeter in series so that the current is measured rather than assumed, pour a measured 200 mL of distilled water into the calorimeter, start the agitator and record the temperature for one minute of simulated time — which, at the simulation’s 5.5× acceleration, corresponds to 330 seconds of heating. From those readings you will calculate the electrical energy supplied, the thermal energy absorbed and the efficiency, and then account for the difference between them.
Educational Goals
Familiarization with the laboratory environment
- Identify the parts of an electrical calorimetry set-up: the variable power source and its rotary knob, the calorimeter body, its lid with the electrode terminals, the agitator button and the thermometer port.
- Recognise which quantity each instrument on the bench is there to supply, and which of them the final calculation actually depends on.
Safe handling of electrical apparatus
- Connect a low-voltage supply with the correct polarity, black to black and red to red, and set the supply voltage before energising the circuit.
- Explain why a multimeter set to measure current must be placed in series and never across a component, and why the 10 A socket is the correct one for a current of several amperes.
Building and instrumenting a circuit
- Break a circuit at one point and reinsert the meter in series without changing anything else about it.
- Read a current from a digital meter and record it with its unit.
Quantitative measurement of energy
- Calculate the electrical energy supplied from E = U I Δt, and the electrical power from P = U I.
- Calculate the thermal energy absorbed by a known mass of water from Q = m c ΔT, taking the temperature rise from the recorded graph.
- Convert consistently between volts, amperes, seconds, grams and joules, and check that the units of every product come out as joules.
Calculating and interpreting an efficiency
- Express the efficiency as η = Q / E × 100 % and state clearly which energy is the input and which the useful output.
- Explain why the result is necessarily less than 100 % in this apparatus, and identify where the missing energy has gone.
Critical evaluation of a measurement
- Distinguish energy that has been stored in the apparatus from energy that has genuinely escaped to the room, and describe an additional measurement that would separate them.
- Predict how the measured efficiency would change if the water were replaced by a liquid of different density and specific heat capacity, and justify the direction of the change.
Protocol
- Turn on the power source.
- Ensure that the potential difference of the source is 4 V (adjust using the rotary knob).
- Put the lid on the calorimeter.
- Insert the thermometer into the hole located on the left on the top of the lid.
- With 2 wires; connect the current source to the electrodes of the calorimeter lid : black terminal to the black terminal; red terminal to the red terminal.
- Set the multimeter to mode A (current measurement).
- Measure the current intensity between the source and the calorimeter. To do this; add the multimeter in series by disconnecting the wire from the positive terminal of the source and connecting it to the left socket (10A).
- Then, take another wire and connect it from the central jack (COM) of the multimeter to the jack of the positive terminal of the source.
- Using the 50 mL graduated cylinder, pour four 50 mL portions of distilled water (200 mL in total) into the 250 mL beaker and place the beaker on the balance to determine its weight.
- Remove the lid of the calorimeter then pour the water from the beaker into it.
- Then replace the lid on the calorimeter.
- Activate the agitator by pressing the green button on the calorimeter lid. The button turns red when the calorimeter is activated.
- Start the stopwatch.
- The temperature measurement results are found in the graph in the results section.
- Let the temperature data record for at least 60 seconds.
- Stop the stopwatch.
- Turn off the generator.
* Note that the speed is accelerated to 5.5x, therefore 60 seconds of heating is equivalent to 330 seconds.
Anticipated Outcomes
Results may vary slightly from one run to another, but the values below are those the simulation produces and are the ones used throughout this section.
| Quantity | Symbol | Value |
|---|---|---|
| Supply voltage | U | 4.00 V |
| Current through the heater | I | 3.60 A |
| Heating time | Δt | 330 s (60 s recorded at 5.5×) |
| Mass of water | m | 200 g (200 mL) |
| Specific heat capacity of water | c | 4.18 J/g·°C |
| Initial temperature | Ti | 21.7 °C |
| Final temperature | Tf | 26.1 °C |
| Temperature rise | ΔT | 4.4 °C |
The energy balance. Two energies are calculated independently and then compared. Neither calculation uses any result of the other, which is what makes the comparison meaningful.
| Quantity | Relationship | Substitution | Result |
|---|---|---|---|
| Electrical energy supplied | E = U I Δt | 4.00 × 3.60 × 330 | 4752 J |
| Thermal energy absorbed by the water | Q = m c ΔT | 200 × 4.18 × 4.4 | 3678 J |
| Efficiency | η = Q / E × 100 | 3678 / 4752 × 100 | 77.4 % |
| Energy not accounted for in the water | E − Q | 4752 − 3678 | 1074 J (22.6 %) |
The power and the load. The supply delivers P = U I = 4.00 × 3.60 = 14.4 W throughout the run, roughly the power of a small desk lamp. From Ohm’s law the heating element presents a resistance of R = U / I = 4.00 / 3.60 = 1.11 Ω, which is characteristic of a low-voltage immersion heater: a large current at a small voltage, rather than the reverse. Multiplying the power by the time gives the same 4752 J as the table, which is a useful arithmetic check — a joule is a watt-second.
What the water would have done in a perfect calorimeter. The heat capacity of 200 g of water is C = m c = 200 × 4.18 = 836 J per degree. If every joule supplied had stayed in the water, the temperature rise would have been ΔTideal = E / C = 4752 / 836 = 5.68 °C, taking the water from 21.7 °C to 27.4 °C. The observed rise falls short of this by 1.28 °C, and that shortfall — not any defect in the heater — is the whole of the 22.6 % that the efficiency calculation reports.
The efficiency can also be read off the slope. The ideal heating rate is P / C = 14.4 / 836 = 0.0172 °C per second; the observed rate is 4.4 / 330 = 0.0133 °C per second. Their ratio is 0.0133 / 0.0172 = 0.774, the same 77.4 %. This is worth pointing out because the simulation’s output is a graph: a student who measures the gradient of the straight portion of the temperature-versus-time trace obtains the efficiency without needing to know the total running time at all, and a curved trace is immediate evidence that the losses are not constant.
A heater is not an inefficient device. The most important idea on this page is that the 77.4 % is not a property of the heating element. A resistor has no output other than heat: there is no light, no motion and no sound to carry energy away, so every joule of electrical work done in it becomes thermal energy, and in that sense an electrical heater is exactly 100 % efficient. What the experiment measures is not how well the conversion was done but where the heat went — how much of it stayed inside the boundary we chose to draw around the water. The number is a containment efficiency, not a conversion efficiency, and the distinction is the reason a heater and an electric motor cannot be compared on a single figure.
Where the missing 1074 J is. Three sinks account for it, and the experiment as written cannot separate them.
- The calorimeter itself. The vessel, the lid, the stirrer and the thermometer all rise through the same 4.4 °C as the water and each stores heat in doing so. If the whole deficit were of this kind, the apparatus would have a heat capacity of Ccal = 1074 / 4.4 = 244 J per degree — equivalent to about 270 g of aluminium (c = 0.90 J/g·°C) or 630 g of copper (c = 0.385 J/g·°C). Both are entirely plausible for a vessel of this size, so the hardware alone can account for most of the shortfall. This energy is not lost; it is merely outside the boundary we drew.
- Conduction and convection to the room. Newton’s law of cooling gives the rate of loss as proportional to the excess temperature, dQ/dt = k (T − Troom). Starting close to room temperature and ending 4.4 °C above it, the mean excess over the run is about 2.2 °C; a calorimeter with a loss coefficient of k = 0.5 W per degree — an illustrative rather than a measured value — would shed roughly 1.1 W, or about 360 J over 330 s. Unlike the first sink, this one is genuinely lost, and it grows as the run continues.
- Evaporation. The latent heat of vaporisation of water is about 2260 J/g, so evaporating just 0.5 g of the 200 g present would remove the entire deficit. With the lid fitted this contribution is small, but it is the reason the lid is specified in the protocol rather than being optional.
The two kinds of deficit behave differently, and that is how to tell them apart. Energy stored in the apparatus is taken up once, early, and is recovered when the calorimeter cools; energy lost to the room accumulates for as long as the water stays warm. A calibration run therefore separates them: heat the same apparatus with a different mass of water and the stored term stays the same while the water term changes, or simply keep recording after the power is switched off and extrapolate the cooling curve back to the moment of switching — the standard graphical correction. The graph is already on screen when the run ends, so this measurement costs nothing but a few seconds of additional recording. Without it, the figure of 77.4 % is a lower bound on the true performance of the heater by an unknown amount.
Would another liquid give the same efficiency? The ideal limit does not depend on the liquid: the first law does not care what absorbs the heat, so a perfectly insulated calorimeter would return 100 % whatever it contained. The measured efficiency, however, depends on the liquid strongly, and in a direction worth predicting before testing. Replacing 200 mL of water with 200 mL of cooking oil (ρ ≈ 0.92 g/mL, c ≈ 2.0 J/g·°C) gives only 184 g holding 368 J per degree, against water’s 836.
| Water | Cooking oil | |
|---|---|---|
| Volume in the calorimeter | 200 mL | 200 mL |
| Mass | 200 g | 184 g |
| Specific heat capacity | 4.18 J/g·°C | ≈ 2.0 J/g·°C |
| Heat capacity of the liquid | 836 J/°C | 368 J/°C |
| Rise for the same 4752 J, ideal | 5.68 °C | 12.9 °C |
| Share taken by a 244 J/°C apparatus | 23 % | 40 % |
| Efficiency predicted on that term alone | 77 % | 60 % |
The apparatus takes a fixed number of joules per degree, so the smaller the heat capacity of the liquid, the larger the fraction of the supplied energy that ends up in the hardware rather than in the sample. The higher final temperature also increases the loss to the room, pushing the measured figure lower still. A student who predicts “the same efficiency, because efficiency is just a ratio” has understood the definition but not the apparatus.
The time-acceleration trap. The simulation runs at 5.5× real time, so the sixty seconds of recording represent 330 seconds of heating, and 330 is the number that belongs in E = U I Δt. Using 60 s instead gives E = 4.00 × 3.60 × 60 = 864 J and an efficiency of 3678 / 864 = 426 %, which is impossible: no measurement can extract more heat than was put in. That absurd answer is a useful built-in check, and it is worth setting deliberately, because recognising that an efficiency above 100 % must indicate an error in the data rather than a remarkable discovery is a more durable skill than getting 77.4 % right the first time.
Why a kettle does better. A domestic kettle performs the same energy conversion and typically reaches 85–90 %, for reasons this experiment makes calculable rather than mysterious. It heats about 1.7 kg of water, some 7100 J per degree, against a stainless steel body of perhaps 250 J per degree — so the hardware claims about 3 % rather than 23 %. It also delivers around 2 kW, finishing in roughly five minutes instead of trickling 14.4 W in for hours, which leaves far less time for heat to escape. Scale and speed, not superior engineering, account for almost all of the difference; the physics on the bench and the physics in the kitchen are identical.
Summary of Assignment by Grade Range
Grade 9–10
Focus: the idea that energy changes form, and that the change can be watched happening on a graph.
- Follow the energy from the wall socket to the water in words, naming each form it takes, and give three household devices that make the same conversion.
- Set the supply to 4 V, assemble the circuit with the correct polarity and start the agitator; record the initial and final temperatures from the graph and calculate the rise.
- Calculate the thermal energy absorbed using Q = m c ΔT with the values supplied, and express the answer in joules with the working shown.
- List, from observation of the apparatus, three places where heat could leave the calorimeter, and say which one the lid is there to prevent.
Grade 11
Focus: the full quantitative treatment — both energies, the efficiency, and the power that connects them.
- Calculate the electrical energy from E = U I Δt, using 330 s rather than 60 s, and explain in one sentence why that is the correct time.
- Calculate the efficiency as η = Q / E × 100 and state which quantity is the input and which the useful output.
- Calculate the power P = U I and the heater’s resistance R = U / I, and verify that P × Δt reproduces E.
- Predict the temperature rise a perfectly insulated calorimeter would have given (ΔT = E / m c) and compare it with the rise observed.
- Obtain the efficiency a second way, from the gradient of the temperature-versus-time graph, and confirm that the two methods agree.
- Predict what would happen to the final temperature if the supply were raised to 6 V, assuming the resistance is unchanged, and justify the prediction.
Grade 12 / College Level
Focus: the location of the system boundary.
- Argue that a resistive heater is thermodynamically 100 % efficient, and explain what quantity the 77.4 % therefore describes.
- Estimate the heat capacity of the calorimeter on the assumption that the entire deficit is stored in it, and comment on whether the resulting figure is physically reasonable for a vessel of this size.
- Design the calibration run that would separate energy stored in the apparatus from energy lost to the surroundings, and specify what would be measured and how it would be analysed.
- Model the loss to the room with Newton’s law of cooling and explain why the measured efficiency must fall as the run is extended.
- Predict the efficiency that would be measured with cooking oil in place of water, justify the direction of the change quantitatively, and state what the result would show about the difference between an ideal and a measured efficiency.
Laboratory essentials
Instruments
- Calorimeter with lid, agitator and electrode terminals
- Adjustable direct-current power source (set to 4 V)
- Multimeter (used in mode A, 10 A socket)
- Connecting wires (4)
- Numeric thermometer
- Numeric balance
- Graduated cylinder (50 mL)
- Beaker (250 mL)
- Timer / stopwatch
Products
- Distilled water (200 mL, poured as four 50 mL portions)