

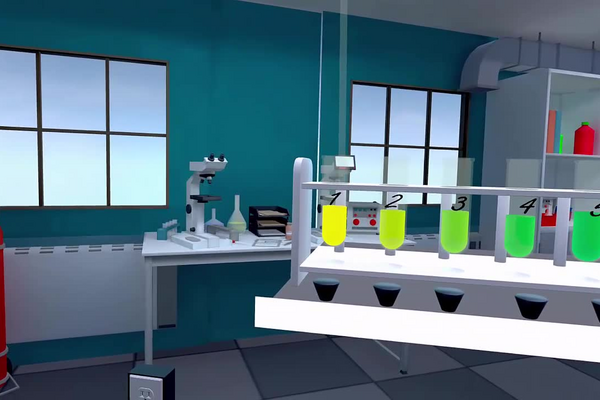
Colorimetry is the cheapest way to measure a chemical quantity: add a reagent that changes colour with the quantity you want, then match the result against a set of references of known value. It needs no power, no calibration and no glassware beyond a tube, which is why it is still the standard method for testing swimming pools and aquariums, for field surveys of lakes and rivers, and for the dipsticks used in clinics. Its limitation is equally plain — the answer is only as good as the eye reading it, and only as fine as the spacing of the references.
The quantity being measured here is pH, defined as pH = −log[H3O+], so that each whole unit of pH is a tenfold change in the concentration of hydronium ions. A universal indicator is not one dye but a blend of several weak acids, each of which changes colour over a different, narrow band of pH. Because their acid dissociation constants are staggered, the blend as a whole changes colour progressively from red through yellow and green to blue across the range of about pH 3 to pH 10, and that colour can be used as a stand-in for a measurement of [H3O+] that would otherwise need an electrode.
In this laboratory you will build the reference scale yourself rather than being handed one. You will measure 25 mL portions of solutions of known pH into a rack of test tubes, add five drops of universal indicator to each, and so produce a colour scale from pH 3 to pH 7. You then treat a sample of lake water the same way, match its colour against your scale to obtain its pH, extend the scale to pH 8 and pH 9 if the sample turns out to be alkaline, and finally check every tube with a pH meter to see how close the colorimetric answer came.
Educational Goals
Understanding pH as a logarithmic scale
- State the definition pH = −log[H3O+] and convert in both directions between a pH and a hydronium concentration.
- Explain why a sample at pH 5 is a thousand times more acidic than one at pH 8, and why a difference of half a pH unit is not a small difference.
Building and using a colorimetric reference scale
- Prepare a series of reference tubes under identical conditions — same volume, same number of drops, same tube — and say why every one of those conditions has to be held constant.
- Determine the pH of an unknown sample by matching it against the series, and quote the answer with a range rather than as a single figure.
- Recognise when a sample falls outside the scale and extend the scale rather than guess.
Handling the indicator and the glassware
- Measure 25 mL in a graduated cylinder and deliver a counted number of drops from a dropper.
- Mix a test tube without loss, and rinse and dry the electrode between tubes so that one solution does not contaminate the next.
Cross-checking one method against another
- Compare the colorimetric result for each tube with the reading from the pH meter and tabulate the difference.
- Explain what the two methods measure and why the electrode is the more trustworthy of the two.
Judging the limits of a visual method
- State the finest resolution a scale in steps of one pH unit can support, and how it would be improved.
- Identify the conditions under which the indicator itself changes the pH of the sample it is measuring.
Protocol
Part 1: Prepare a colorimetry scale using the pH indicator available to you
- Using the graduated cylinder, measure 25 mL of pH3 solution and then pour into test tube 1.
- Repeat step a) with the pH 4,5,6 and 7 solutions and test tubes 2,3,4 and 5.
- Using the dropper, add 5 drops of pH indicator to each of test tubes 1 to 5.
- Mix the contents of the test tubes with a glass rod, or by putting on a stopper and gently mixing from right to left.
- Using the graduated cylinder, measure 25 mL of the lake water sample and then pour into test tube 6.
- Using the dropper, add 5 drops of pH indicator to test tube 6.
- Mix the contents of the test tube with a glass rod, or by putting on a stopper and gently mixing from right to left.
Part 2: Determine the pH of river water using the colorimetric scale
- Determine the pH of river water by comparing the color of the sample in test tube 6 with the colorimetric scale on the poster that is on the counter.
-> If the pH seems to be above 7, complete the colorimetry scale using the pH 8 and 9 solutions and test tubes 7 and 8. If the pH is below 7, move on to Part 3 to validate the pH of each solution with the pH meter.
- Using the graduated cylinder, measure 25 mL of pH 8 solution and then pour into test tube 7.
- Using the dropper, add 5 drops of pH indicator into test tube 7.
- Using the graduated cylinder, measure 25 mL of pH 9 solution and then pour into test tube 8.
- Using the dropper, add 5 drops of pH indicator into test tube 8.
- Mix the contents of the test tubes with a glass rod, or by putting on a stopper and gently mixing from right to left.
- Compare again the pH of the river water using this new scale (pH 3 to 9).
Part 3: Validate the pH of each solution with the pH meter
- Insert the pH meter electrode into the test tube containing the river water (test tube 6) and into the other test tubes to validate the pH of each solution.
- Record the value displayed on the digital dial of the pH meter.
Don’t forget: between measurements; rinse the electrode with distilled water and dry it with a paper towel.
Anticipated Outcomes
There is no single correct answer to this laboratory. The pH of the lake water sample is drawn afresh each time the activity is restarted and lies somewhere between 3 and 9, so what is marked is not the number the student reports but the procedure, the range they quote around it, and the agreement between their colorimetric reading and the pH meter. The reference series itself, on the other hand, is fully determined: eight tubes of known pH must give the colours of the universal indicator chart, in order, with no reversals.
| Tube | Standard pH | [H3O+] (mol/L) | Colour expected from a universal indicator |
|---|---|---|---|
| 1 | 3 | 1 × 10⁻³ | Red to red-orange |
| 2 | 4 | 1 × 10⁻⁴ | Orange |
| 3 | 5 | 1 × 10⁻⁵ | Yellow-orange |
| 4 | 6 | 1 × 10⁻⁶ | Yellow to yellow-green |
| 5 | 7 | 1 × 10⁻⁷ | Green |
| 6 | the sample | to be determined | Whatever the sample gives; matched against the others |
| 7 | 8 | 1 × 10⁻⁸ | Blue-green |
| 8 | 9 | 1 × 10⁻⁹ | Blue |
What the pH scale is saying. Because pH = −log[H3O+], a pH of 5 corresponds to [H3O+] = 10−5 mol/L and a pH of 8 to 10−8 mol/L: the acidic sample holds a thousand times more hydronium than the alkaline one. This is worth making explicit before the colour matching starts, because a student who reads the sample as “about 6 or 7” has quoted a tenfold range in hydronium concentration. In fresh water it also matters biologically: most fish eggs fail below about pH 5.5, and a lake at pH 4 is effectively sterile.
Why a universal indicator changes colour gradually. A single indicator is a weak acid whose two forms have different colours: HIn ⇌ H+ + In−, with Ka = [H+][In−] / [HIn], and therefore [In−] / [HIn] = Ka / [H+]. At pH = pKa the two forms are present in equal amounts and the colour is halfway between them; one pH unit lower the ratio is 1 : 10 and the acid colour dominates; one unit higher it is 10 : 1 and the base colour dominates. A single dye therefore has a usable transition of only about two pH units, which is why a “universal” indicator is a blend of four or five dyes with pKa values spaced roughly two units apart. The continuous rainbow on the chart is the sum of those overlapping transitions, not the behaviour of any one molecule.
Why five drops, and why the same five drops in every tube. The indicator is itself a weak acid, so it contributes hydronium to whatever it is added to. Five drops is roughly 0.25 mL, or about 1 % of a 25 mL portion — small enough to leave a buffered standard untouched, but not necessarily small enough for a poorly buffered natural water, which is exactly what a lake sample may be. Adding a different number of drops to different tubes changes the depth of colour as well, which would corrupt the comparison even if the pH did not shift. This is the single procedural point on which the whole determination rests, and it is worth marking.
What the pH meter adds. The glass electrode responds to hydronium activity through the Nernst relation, E = E0 − 0.0592 × pH at 25 °C, that is 59.2 mV for every pH unit, and the meter simply converts that voltage to a number. Two consequences follow. The first is resolution: a meter displaying to 0.1 pH resolves a 6 mV change, whereas a colour scale in steps of one whole unit cannot honestly be read to better than about half a unit even by a careful eye. The second is that the two methods are independent, so Part 3 is a real check rather than a repetition, and the expected outcome is agreement to within roughly ±0.5 pH on every tube. A systematic disagreement in one direction across all eight tubes points at the meter’s calibration; a disagreement on the sample alone points at the indicator having shifted the pH of an unbuffered water.
Summary of Assignment by Grade Range
Grade 9–10
Focus: observation, vocabulary and careful technique. Students build the scale and use it, without handling logarithms.
Activities:
- Measure 25 mL into each tube and count exactly five drops of indicator into each, and explain why both numbers must be the same for every tube.
- Record the colour of each of the reference tubes and of the sample in a table, and label the ends of the scale acidic, neutral and alkaline.
- Give the pH of the lake water as a range, such as “between 6 and 7”, rather than as a single number.
- Read the pH meter for each tube and say whether the colour scale agreed with it.
- Name three everyday places where pH is measured with a colour comparison.
Grade 11
Focus: the logarithmic scale and quantitative comparison of the two methods.
Activities:
- Convert every standard pH in the series to a hydronium concentration using [H3O+] = 10−pH, and tabulate the two columns side by side.
- State how many times more acidic the most acidic standard is than the most alkaline, and check the answer against the difference in pH.
- Tabulate the colorimetric reading and the meter reading for all eight tubes and compute the difference for each; state whether the disagreement is random or systematic.
- Explain, using Ka = [H+][In−] / [HIn], why a single indicator changes colour over about two pH units.
- Calculate what fraction of each tube is indicator solution, and argue whether that is small enough to ignore.
Grade 12 / College Level
Focus: the physical basis of both instruments, error analysis, and criticism of the method.
Activities:
- Derive the resolution of the electrode from E = E0 − 0.0592 × pH, state the voltage change corresponding to 0.1 pH, and say what that implies about the meter’s input impedance.
- Show why adding a weak-acid indicator to a poorly buffered natural water can shift its pH, and calculate an upper bound on the shift for a stated indicator concentration and an unbuffered sample.
- Propose how a survey of a real lake would be designed — number of sites, time of day, depth, temperature correction — and say why a single sample tells you almost nothing about a lake.
Laboratory essentials
Instruments
- Test tubes (8) in a rack, with stoppers
- Graduated cylinder (25 mL)
- Droppers
- Glass rod
- Beakers (50 mL and 250 mL)
- pH meter with electrode
- Colorimetric pH chart (poster, pH 0 to 14)
- Paper towel
Products
- pH standard solutions (pH 3 to pH 9)
- Lake water sample (pH randomised between 3 and 9)
- Universal pH indicator solution