

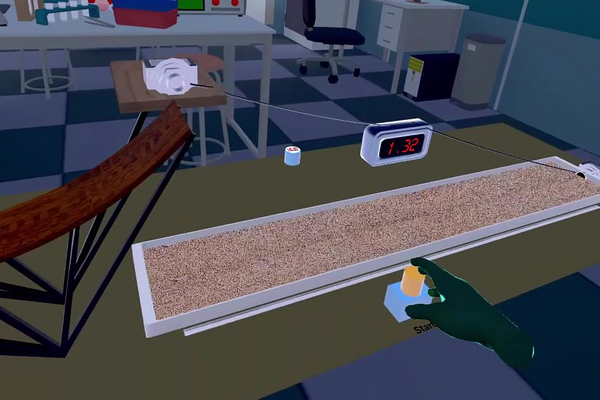
This laboratory explores the principles of projectile motion and investigates the role of air resistance in real-world conditions. Projectile motion describes the movement of an object launched into the air under the influence of gravity. In an idealized model, the only force acting on the object after launch is gravity, resulting in a predictable parabolic trajectory. However, in practical situations, additional forces such as air resistance can influence the motion and lead to deviations from theoretical predictions.
In this experiment, a marble is launched from a ramp equipped with a descending ramp inclined at 31°, launching from an ascending ramp inclined at 45° whose lip sits 12 cm above the sand, and its motion is observed as it travels through the air and lands in a sandbox. By varying the starting position of the marble along the ramp, students modify the initial conditions of the motion, particularly the exit speed. These variations allow for the investigation of how physical parameters such as time of flight, horizontal distance, and exit velocity influence the trajectory.
The laboratory emphasizes the comparison between theoretical calculations and experimental measurements. Students will apply kinematic equations to predict the motion of the marble in the absence of air resistance and then compare these predictions with observed data. This comparison provides insight into the limitations of ideal models and highlights the impact of real-world forces such as air resistance.
Through this activity, students develop a deeper understanding of motion in two dimensions, the independence of horizontal and vertical components of motion, and the importance of experimental validation in physics. The lab also reinforces the use of precise measurement techniques and critical analysis when interpreting results.
Educational Goals
Understanding projectile motion
- Describe projectile motion as a two-dimensional phenomenon with independent horizontal and vertical components: gravity accelerates the vertical motion while the horizontal motion remains uniform in the absence of air resistance.
Application of kinematic equations
- Apply the kinematic equations to calculate time of flight, horizontal displacement and velocity components, and use them to model the marble’s motion under ideal, drag-free conditions.
Analysis of initial conditions
- Examine how the choice of release point on the ramp sets the marble’s exit speed, and how that single initial condition determines the whole trajectory that follows.
Experimental measurement and data collection
- Use the photodiode gates and timer to measure time of flight, horizontal distance and exit speed, and record the results in a clear, structured table.
Comparison between theory and experiment
- Compare measured values against drag-free predictions, compute relative differences, and judge whether the discrepancies are significant.
Understanding the role of air resistance
- Determine whether air resistance has a measurable effect on the marble’s flight, knowing that drag can only remove energy from the marble — it shortens a flight, never lengthens it.
Protocol
Introduction
- The setup in front of you reproduces a ramp equipped with a springboard inclined at 31° and a sandbox for the landing of a ball.
- With the practical laboratory, you must determine whether air resistance influences the ball’s trajectory once it has left the springboard.
- To do this, you will collect certain physical parameters of the ball’s motion during its flight that are likely to be affected by the choice of the place on the ramp where the descent begins.
Procedures
- Position one of the photodiode gates on the board at the end of the ramp, and the other sensor at the end of the sandbox.
- Position the ball on the ramp at the highest point.
- Press the “Start” button to release the ball.
- Observe the demonstration.
- The data from the demonstration are entered in the results table.
- Repeat steps 2 to 5 by successively positioning the ball at the three other lower positions.
Questions
- Once the data has been collected, you will need to answer the following questions:
a) What are the collected parameters?
b) How to calculate the time of flight and the distance in the sandbox if no resistance was offered by the air?
Consider that the upward slope has an inclination of 45° and a height of 0.12 m.
c) Compare the data obtained in the laboratory to the theoretical data (calculated in the previous step).
d) For each trial (height on the ramp), determine whether air resistance is negligible or not.
Anticipated Outcomes
The apparatus has two ramps, and only one of them sets the launch angle. The ball rolls down a descending ramp inclined at 31°, then runs up an ascending ramp inclined at 45° whose lip sits 12 cm above the sand. It is the 45° ascending ramp that launches the ball, so 45° is the angle used in every calculation below. The 31° figure describes the descent and plays no part in the flight.
The height that matters is the net drop. The ball does not fall through its full starting height: it climbs back up 12 cm before leaving the apparatus. The drop available to accelerate it is therefore Δh = hstart − 12 cm. Overlooking this is the single most common error in analysing this laboratory, and it inflates every predicted speed.
| Start position on the ramp | Net drop Δh | Exit speed | Flight time | Range, no air resistance | Range with air resistance |
|---|---|---|---|---|---|
| 47 cm | 35 cm | 2.214 m/s | 0.38 s | 60 cm | 48 – 54 cm |
| 37 cm | 25 cm | 1.871 m/s | 0.34 s | 45 cm | 36 – 40 cm |
| 28 cm | 16 cm | 1.497 m/s | 0.29 s | 31 cm | 25 – 28 cm |
| 19 cm | 7 cm | 0.990 m/s | 0.24 s | 17 cm | 14 – 15 cm |
Exit speed of a rolling ball. The ball rolls rather than slides, so conservation of energy has to supply two accounts, translation and rotation:
mgΔh = ½mv² + ½Iω²
For a uniform sphere I = (2/5)mr², and rolling without slipping ties the two motions together through v = ωr. Substituting both reduces the expression to mgΔh = (7/10)mv², and therefore:
v = √(10 g Δh / 7)
Both the mass and the radius cancel, so any ball released from the same position leaves at the same speed. Taking the highest release: Δh = 0.35 m gives v = √(10 × 9.81 × 0.35 / 7) = 2.215 m/s, matching the 2.214 m/s the apparatus reports. Because √(10/7) is smaller than √2, a rolling ball leaves about 15 % slower than a frictionless sliding block would from the same drop — two sevenths of the energy is locked up in spin and is unavailable to the flight.
The flight. At the lip the velocity resolves into vx = v cos 45° and vy = v sin 45°. From there gravity acts alone. The vertical motion fixes the time of flight through
0 = hlip + (v sin 45°) t − ½ g t² with hlip = 0.12 m
and the horizontal motion, which proceeds at constant speed, then gives the range as Δx = (v cos 45°) t. For the highest release, vx = vy = 1.566 m/s, the vertical equation solves to t = 0.383 s, and the range follows as 1.566 × 0.383 = 0.600 m. Every row of the table above reproduces this way to within a centimetre.
What air resistance can and cannot do. Drag opposes motion, so it can only take energy out of the ball. Its signature is therefore one-sided: a measured range may fall short of the drag-free prediction but can never exceed it. That asymmetry is what makes this laboratory a genuine test rather than a demonstration. A range 10–20 % below prediction is the expected result and is consistent with drag. A range at or above prediction cannot be caused by the air, and would point instead at the analysis — most often the use of 31° in place of 45°, or the full start height in place of the net drop.
Why the shortfall is a percentage rather than a fixed distance. Drag grows with speed, so the faster launches lose proportionally more of their range in absolute terms: the 47 cm release gives up 6–12 cm while the 19 cm release gives up only 2–3 cm. Expressing the deficit as a percentage of the predicted range is what makes the four trials comparable, and a consistent percentage across all four is strong evidence that drag, rather than a geometric mistake, is responsible. A geometric error would bias every row in the same direction by the same ratio of angles or heights, not by an amount that scales with speed.
Summary of Assignment by Grade Range
Grade 9–10
Focus: projectile motion as an observable phenomenon. Students release the marble from each of the four ramp positions, watch the flight, and record the measured time, distance and exit speed from the results table. They state the pattern qualitatively — a higher release point means a faster exit, a longer flight and a longer range — and are introduced to the idea that the horizontal and vertical parts of the motion can be thought about separately: gravity pulls down, while nothing pushes sideways.
Grade 11
Focus: the quantitative kinematics. Students resolve the exit velocity into components with vx = v cos θ and vy = v sin θ, solve the vertical equation for the time of flight, predict the range, and compare each measured value with its prediction as a percentage.
Grade 12 / College Level
Focus: model validation. Students derive the rolling-sphere exit speed v = √(10gh/7) from energy conservation and explain why mass and radius cancel; they treat the drag-free calculation as a hypothesis to be tested rather than an answer to be confirmed. The decisive piece of reasoning is the one-sidedness of drag: air resistance can only shorten a flight, so a measured range at or beyond the prediction falsifies the analysis somewhere else — and finding where is the exercise. Systematic and random errors are distinguished and propagated, and conclusions are argued from the pattern across all four release heights rather than from any single trial.
Laboratory essentials
Instruments
- Descending ramp, 31° incline
- Ascending launch ramp, 45° incline, lip 12 cm above the sand
- Projectile marble
- Sandbox
- Photodiode gates & timer
- Camera
Products
None — this laboratory uses no chemical reagents.