

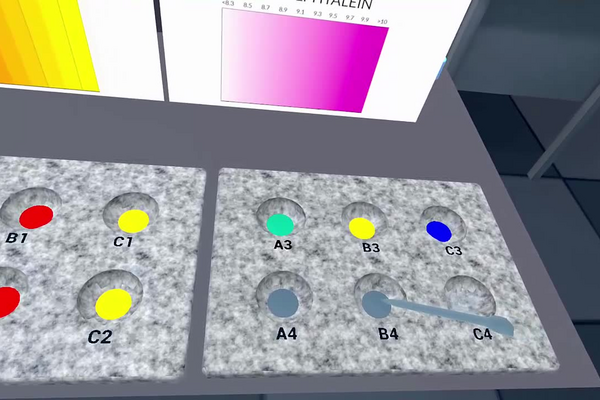
An acid-base indicator is a dye that wears one colour in acid and another in alkali. Swimming-pool test kits, soil kits, aquarium kits and the universal paper in every school laboratory all work this way, and so does the endpoint of a titration. What makes an indicator useful is also what limits it: a single dye answers only one question — is the pH above or below my transition range? — so a single well can never give a pH, only an inequality. Put several dyes with different ranges alongside one another, however, and the inequalities close in on each other from both sides.
Each dye behaves this way because the dye is itself a weak acid. Its protonated form HIn and its deprotonated form In− absorb light differently, and the two are in equilibrium: HIn + H2O ⇌ In− + H3O+. Rearranging the equilibrium expression gives pH = pKIn + log([In−]/[HIn]), so the ratio of the two coloured forms is fixed by the pH alone. The eye stops distinguishing a mixture from the pure form at a ratio of roughly one to ten, which is why every indicator changes over a band about two pH units wide, centred on its own pKIn, and shows a single flat colour on either side of that band.
In this laboratory, you will fill two six-well plates as a three-by-four grid: three unknown solutions poured down the columns A, B and C, and four indicators — methyl orange, methyl red, bromothymol blue and phenolphthalein — laid across the rows 1 to 4. Twelve wells give twelve colours. You will capture the plate with the tablet, match each well against the graduated reference chart posted on the bench for that indicator, write down the inequality each colour implies, and combine the four inequalities in each column to bracket the pH of that unknown. One of the three brackets will turn out to be one-sided, which is a result in itself.
Educational Goals
Working with a well plate
- Load a twelve-well grid systematically, one solution per column and one indicator per row, so that every well has a known identity before any colour appears.
- Use a separate dropper for each liquid and deliver a counted number of drops, and explain what cross-contamination between wells would do to the result.
How an indicator works
- Describe an indicator as a weak acid whose protonated and deprotonated forms differ in colour, and relate its transition range to its pKIn.
- Explain why a transition range is about two pH units wide and why an indicator gives no information at all about a pH outside its own range.
Reading a colour as an inequality
- Convert an observed well colour into a statement about pH — an upper bound, a lower bound, or a bracket when the dye is caught mid-transition.
- Match a partly transitioned colour against the graduated bench chart to estimate a pH to about a tenth of a unit, and say why that estimate is only available for one of the twelve wells in each column.
Combining evidence from several tests
- Intersect four inequalities to obtain the narrowest bracket the plate supports for each unknown.
- Recognise when a set of tests fails to bound a result from one side, and state what further indicator would be needed to close the bracket.
Recording and reporting
- Capture the plate with the tablet and use the saved image as the primary record rather than relying on memory.
- Report each unknown as a bracket with its supporting evidence, not as a bare number.
Protocol
Two well plates are on the table, labeled from A to C and from 1 to 4.
- Put 5 drops of unknown solution 1 into each well of column A.
- Put 5 drops of unknown solution 2 into each well of column B.
- Put 5 drops of unknown solution 3 into each well of column C.
- Add 2 drops of methyl orange into each well of row 1.
- Add 2 drops of methyl red into each well of row 2.
- Add 2 drops of bromothymol blue into each well of row 3.
- Add 2 drops of phenolphthalein into each well of row 4.
- Using the tablet, capture an image of the well plates by clicking the button (Save image).
- The colors of each of the wells are shown in the captured image that you can find in the “Image” section of the results.
The results are found in the results table.
Anticipated Outcomes
The four indicators are chosen so that their transition ranges tile the pH scale from about 3 to about 10 with only small gaps. The ranges below are the ones printed on the graduated reference charts standing on the bench, and the well colours are those produced by the simulation.
| Indicator | Row | Transition range (bench chart) | Acid form | Base form | pKIn |
|---|---|---|---|---|---|
| Methyl orange | 1 | 3.2 to 4.4 | red | yellow | ≈ 3.7 |
| Methyl red | 2 | 4.4 to 6.2 | red | yellow | ≈ 5.1 |
| Bromothymol blue | 3 | 6.0 to 7.5 | yellow | blue | ≈ 7.1 |
| Phenolphthalein | 4 | 8.3 to 10.0 | colourless | pink to magenta | ≈ 9.4 |
The plate. The twelve wells and what each colour implies are set out below. The last two rows give the intersection of the four inequalities in each column and the identity of the solution.
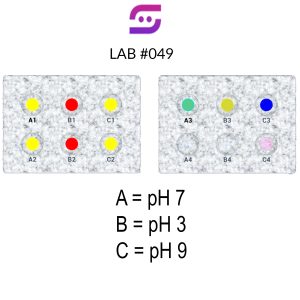
The plate as captured by the tablet at the end of the run. Columns A, B and C are the three unknown solutions; rows 1 to 4 are methyl orange, methyl red, bromothymol blue and phenolphthalein.
| Row / indicator | Column A (unknown 1) | Column B (unknown 2) | Column C (unknown 3) |
|---|---|---|---|
| 1 — methyl orange | yellow → pH > 4.4 | red → pH < 3.2 | yellow → pH > 4.4 |
| 2 — methyl red | yellow → pH > 6.2 | red → pH < 4.4 | yellow → pH > 6.2 |
| 3 — bromothymol blue | green → 6.0 < pH < 7.5 | yellow → pH < 6.0 | blue → pH > 7.5 |
| 4 — phenolphthalein | colourless → pH < 8.3 | colourless → pH < 8.3 | pink → 8.3 < pH < 10.0 |
| Bracket from the plate | 6.2 to 7.5, and ≈ 7.0 by matching the green | pH < 3.2 — no lower bound | 8.3 to 10.0, and ≈ 9.0 by matching the pink |
| Identity | H2O, pH 7.00 | HCl 1.0 × 10⁻³ mol/L, pH 3.00 | NaOH 1.0 × 10⁻⁵ mol/L, pH 9.00 |
Checking the three identities. Each published pH follows from the concentration in one line. Pure water self-ionizes to the extent Kw = [H3O+][OH−] = 1.0 × 10⁻¹⁴ at 25 °C, so [H3O+] = √Kw = 1.0 × 10⁻⁷ mol/L and pH = 7.00. Hydrochloric acid ionizes completely, so unknown 2 has [H3O+] = 1.0 × 10⁻³ mol/L and pH = −log(1.0 × 10⁻³) = 3.00. Sodium hydroxide dissociates completely, so unknown 3 has [OH−] = 1.0 × 10⁻⁵ mol/L, pOH = 5.00 and pH = 14.00 − 5.00 = 9.00. All three fall inside the brackets the plate gives, and unknowns 1 and 3 are pinned to within a few tenths.
Summary of Assignment by Grade Range
Grade 9–10
Focus: careful loading of the plate, accurate description of colour, and the idea that a colour is evidence about pH rather than a value of pH.
Activities: load the twelve wells in the order given and keep a written map of which solution and which indicator is in each; name the colour in each well and copy the saved image into the notebook; for each well, read off the bench chart whether the pH is above or below the indicator’s range; identify the one well on the plate that is neither of the indicator’s two colours and say what that means; rank the three unknowns from most acidic to most alkaline.
Grade 11
Focus: turning twelve observations into three brackets.
Activities: write the inequality implied by each of the twelve wells; intersect the four inequalities in each column and state the resulting bracket; estimate the pH of unknowns 1 and 3 to a tenth of a unit by matching the green and pink wells against the graduated charts; explain why unknown 2 has only an upper bound and name an indicator that would give a lower one; convert each estimated pH to a hydronium concentration and check it against the stated concentration of the solution.
Grade 12 / College Level
Focus: the indicator equilibrium, and the limits of a colorimetric method.
Activities: derive pH = pKIn + log([In−]/[HIn]) from the indicator’s acid constant and show that a 1:10 to 10:1 ratio spans two pH units; estimate pKIn for each of the four dyes from the midpoint of its charted range and compare with published values; calculate the fraction of bromothymol blue in its basic form in well A3 given pH 7.0; estimate how much the 2 drops of indicator could shift the pH of the 5 drops of unbuffered water in column A and comment on whether column A can be trusted as a measurement; propose a set of indicators that would bracket any pH from 1 to 13 to within one unit, and calculate how many dyes that requires.
Laboratory essentials
Instruments
- Well plates (2, six wells each; columns labelled A to C, rows labelled 1 to 4)
- Droppers (7 — one per unknown solution and one per indicator)
- Tablet (for capturing and viewing the plate image)
- Graduated reference charts for the four indicators (on the bench)
Products
- Methyl orange (indicator, transition 3.2 to 4.4)
- Methyl red (indicator, transition 4.4 to 6.2)
- Bromothymol blue (indicator, transition 6.0 to 7.5)
- Phenolphthalein (indicator, transition 8.3 to 10.0)
- Unknown solutions 1, 2 and 3